|
For Pilots and Flight Operations Personnel PART I. WHAT YOU SHOULD KNOW ABOUT WEATHER
Since early childhood, you have expressed the comfort of weather in degrees of temperature. Why, then, do we stress temperature in aviation weather? Look at your flight computer; temperature enters into the computation of most parameters on the computer. In fact, temperature can be critical to some flight operations. As a foundation for the study of temperature effects on aviation and weather, this chapter describes commonly used temperature scales, relates heat and temperature, and surveys temperature variations both at the surface and aloft.
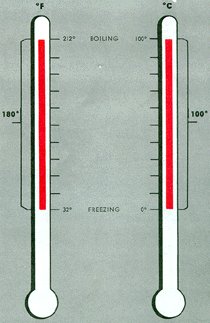
Traditionally, two common temperature references are the melting point of pure ice and the boiling point of pure water at sea level. The melting point of ice is 0° C or 32° F; the boiling point of water is 100° C or 212° F. Thus, the difference between melting and boiling is 100° Celsius or 180° Fahrenheit; the ratio between degrees Celsius and Fahrenheit is 100/180 or 5/9. Since 0° F is 32 Fahrenheit degrees colder than 0° C, you must apply this difference when comparing temperatures on the two scales. You can convert from one scale to the other using one of the following formulae: C = 5/9 (F - 32) F = (9/5 C) + 32 where C is degrees Celsius and F is degrees Fahrenheit. Figure 3 compares the two scales. Many flight computers provide for direct conversion of temperature from one scale to the other. Section 16 {Should be Section 14 - Ed.} , AVIATION WEATHER SERVICES has a graph for temperature conversion.
Temperature we measure with a thermometer. But what makes a thermometer work? Simply the addition or removal of heat. Heat and temperature are not the same; how are they related?
The Earth receives energy from the sun in the form of solar radiation. The Earth and its atmosphere reflect about 55 percent of the radiation and absorb the remaining 45 percent converting it to heat. The Earth, in turn, radiates energy, and this outgoing radiation is "terrestrial radiation." It is evident that the average heat gained from incoming solar radiation must equal heat lost through terrestrial radiation in order to keep the earth from getting progressively hotter or colder. However, this balance is world-wide; we must consider regional and local imbalances which create temperature variations.
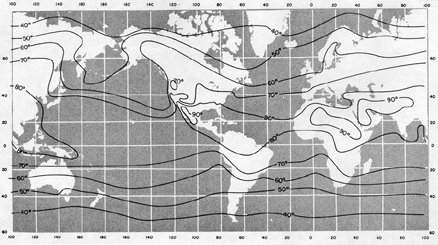
DIURNAL VARIATION Diurnal variation is the change in temperature from day to night brought about by the daily rotation of the Earth. The Earth receives heat during the day by solar radiation but continually loses heat by terrestrial radiation. Warming and cooling depend on an imbalance of solar and terrestrial radiation. During the day, solar radiation exceeds terrestrial radiation and the surface becomes warmer. At night, solar radiation ceases, but terrestrial radiation continues and cools the surface. Cooling continues after sunrise until solar radiation again exceeds terrestrial radiation. Minimum temperature usually occurs after sunrise, sometimes as much as one hour after. The continued cooling after sunrise is one reason that fog sometimes forms shortly after the sun is above the horizon. We will have more to say about diurnal variation and topographic surfaces. SEASONAL VARIATION In addition to its daily rotation, the Earth revolves in a complete orbit around the sun once each year. Since the axis of the Earth tilts to the plane of orbit, the angle of incident solar radiation varies seasonally between hemispheres. The Northern Hemisphere is warmer in June, July, and August because it receives more solar energy than does the Southern Hemisphere. During December, January, and February, the opposite it true; the Southern Hemisphere receives more solar energy and is warmer. Figures 4 and 5 show these seasonal surface temperature variations.
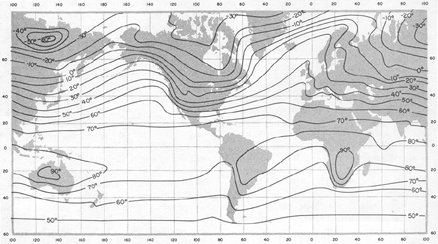
Figure 5. World-wide average surface temperatures in January when the Northern Hemisphere is in the cold season and the Southern Hemisphere is warm. Note that in the Northern Hemisphere, continents are colder than oceanic areas at corresponding latitudes, and in the Southern Hemisphere continents are warmer than oceans.
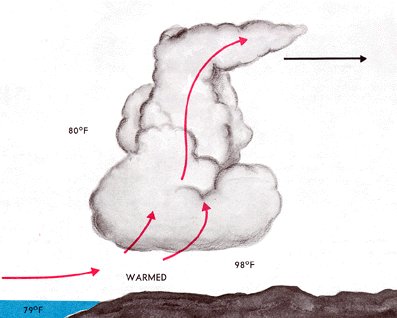
VARIATION WITH LATITUDE The shape of the Earth causes a geographical variation in the angle of incident solar radiation. Since the Earth is essentially spherical, the sun is more nearly overhead in equatorial regions than at higher latitudes. Equatorial regions, therefore, receive the most radiant energy and are warmest. Slanting rays of the sun at higher latitudes deliver less energy over a given area with the least being received at the poles. Thus, temperature varies with latitude from the warm Equator to the cold poles. You can see this average temperature gradient in figures 4 and 5. VARIATIONS WITH TOPOGRAPHY Not related to movement or shape of the earth are temperature variations induced by water and terrain. As stated earlier, water absorbs and radiates energy with less temperature change than does land. Large, deep water bodies tend to minimize temperature changes, while continents favor large changes. Wet soil such as in swamps and marshes is almost as effective as water in suppressing temperature changes. Thick vegetation tends to control temperature changes since it contains some water and also insulates against heat transfer between the ground and the atmosphere. Arid, barren surfaces permit the greatest temperature changes. These topographical influences are both diurnal and seasonal. For example, the difference between a daily maximum and minimum may be 10° or less over water, near a shore line, or over a swamp or marsh, while a difference of 50° or more is common over rocky or sandy deserts. Figures 4 and 5 show the seasonal topographical variation. Note that in the Northern Hemisphere in July, temperatures are warmer over continents than over oceans; in January they are colder over continents than over oceans. The opposite is true in the Southern Hemisphere, but not as pronounced because of more water surface in the Southern Hemisphere. To compare land and water effect on seasonal temperature variation, look at northern Asia and at southern California near San Diego. In the deep continental interior of northern Asia, July average temperature is about 50° F; and January average, about -30° F. Seasonal range is about 80° F. Near San Diego, due to the proximity of the Pacific Ocean, July average is about 70° F and January average, 50° F. Seasonal variation is only about 20° F. Abrupt temperature differences develop along lake and ocean shores. These variations generate pressure differences and local winds which we will study in later chapters. Figure 6 illustrates a possible effect.
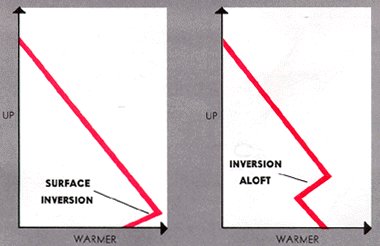
Prevailing wind is also a factor in temperature controls. In an area where prevailing winds are from large water bodies, temperature changes are rather small. Most islands enjoy fairly constant temperatures. On the other hand, temperature changes are more pronounced where prevailing wind is from dry, barren regions. Air transfers heat slowly from the surface upward. Thus, temperature changes aloft are more gradual than at the surface. Let's look at temperature changes with altitude. VARIATION WITH ALTITUDE In chapter 1, we learned that temperature normally decreases with increasing altitude throughout the troposphere. This decrease of temperature with altitude is defined as lapse rate. The average decrease of temperature - average lapse rate - in the troposphere is 2° C per 1,000 feet. But since this is an average, the exact value seldom exists. In fact, temperature sometimes increases with height through a layer. An increase in temperature with altitude is defined as a inversion, i.e., lapse rate is inverted. An inversion often develops near the ground on clear, cool nights when wind is light. The ground radiates and cools much faster than the overlying air. Air in contact with the ground becomes cold while the temperature a few hundred feet above changes very little. Thus, temperature increases with height. Inversions may also occur at any altitude when conditions are favorable. For example, a current of warm air aloft overrunning cold air near the surface produces an inversion aloft. Figure 7 diagrams temperature inversions both surface and aloft. Inversions are common in the stratosphere.
|