|
For Pilots and Flight Operations Personnel PART I. WHAT YOU SHOULD KNOW ABOUT WEATHER
Differences in temperature create differences in pressure. These pressure differences drive a complex system of winds in a never ending attempt to reach equilibrium. Wind also transports water vapor and spreads fog, clouds, and precipitation. To help you relate wind to pressure patterns and the movement of weather systems, this chapter explains convection and pressure gradient force, describes the effects of the Coriolis and frictional forces, relates convection and these forces to the general circulation, discusses local and small scale wind systems, introduces you to wind shear, and associates wind with weather.
* Frequently throughout this book, we refer to air as warm, cool, or cold. These terms refer to relative temperatures and not to any fixed temperature reference or to temperatures as they may affect our comfort. For example, compare air at -10° F to air at 0° F; relative to each other, the -10° F air is cool and the 0° F, warm. 90° F would be cool or cold relative to 100° F.
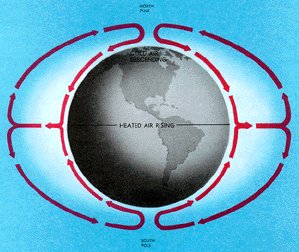
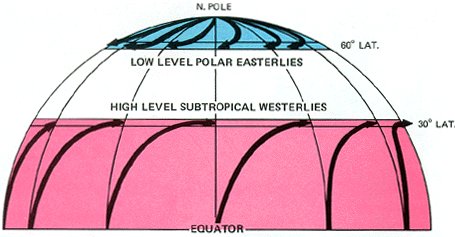
Because of uneven heating of the Earth, surface pressure is low in warm equatorial regions and high in cold polar regions. A pressure gradient develops from the poles to the Equator. If the Earth did not rotate, this pressure gradient force would be the only force acting on the wind. Circulation would be two giant hemispheric convective currents as shown in figure 19. Cold air would sink at the poles; wind would blow straight from the poles to the Equator ; warm air at the Equator would be forced upward; and high level winds would blow directly toward the poles. However, the Earth does rotate; and because of its rotation, this simple circulation is greatly distorted.
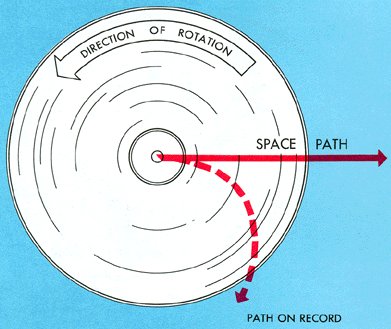
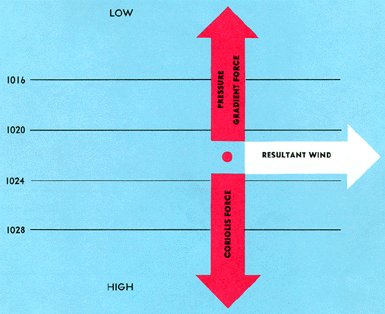
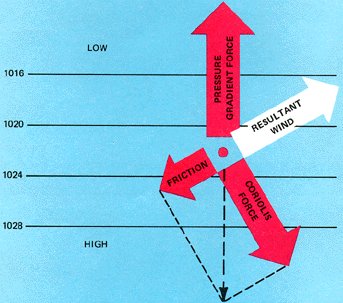
The Coriolis force affects the paths of aircraft; missiles; flying birds; ocean currents; and most important to the study of weather, air currents. The force deflects air to the right in the Northern Hemisphere and to the left in the Southern Hemisphere. This book concentrates mostly on deflection to the right in the Northern Hemisphere. Coriolis force is at a right angle to wind direction and directly proportional to wind speed. That is, as wind speed increases, coriolis force increases. At a given latitude, double the wind speed and you double the coriolis force. Why at a given latitude? Coriolis force varies with latitude from zero at the Equator to a maximum at the poles. It influences wind direction everywhere except immediately at the Equator; but the effects are more pronounced in middle and high latitudes. Remember that the pressure gradient force drives the wind and is perpendicular to isobars. When a pressure gradient force is first established, wind begins to blow from higher to lower pressure directly across the isobars. However, the instant air begins moving, Coriolis force deflects it to the right. Soon the wind is deflected a full 90° and is parallel to the isobars or contours. At this time, Coriolis force exactly balances pressure gradient force as shown in figure 21. With the forces in balance, wind will remain parallel to isobars or contours. Surface friction disrupts this balance as we discuss later; but first let's see how Coriolis force distorts the fictitious global circulation shown in figure 19.
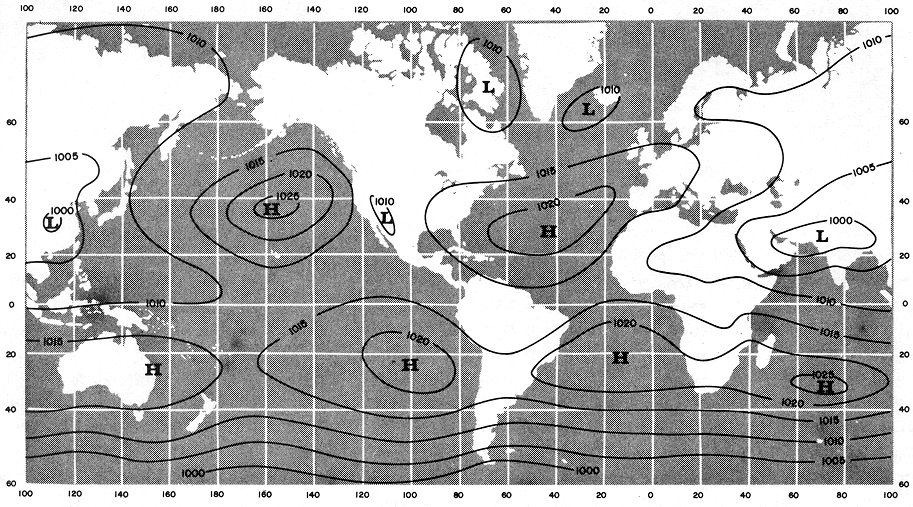
Figure 23. Mean world-wide surface pressure distribution in July. In the warm Northern Hemisphere, warm land areas tend to have low pressure, and cool oceanic areas tend to have high pressure. In the cool Southern Hemisphere, the pattern is reversed; cool land areas tend to have high pressure; and water surfaces, low pressure. However, the relationship is not so evident in the Southern Hemisphere because of relatively small amounts of land. The subtropical high pressure belts are clearly evident at about 30° latitude in both hemispheres.
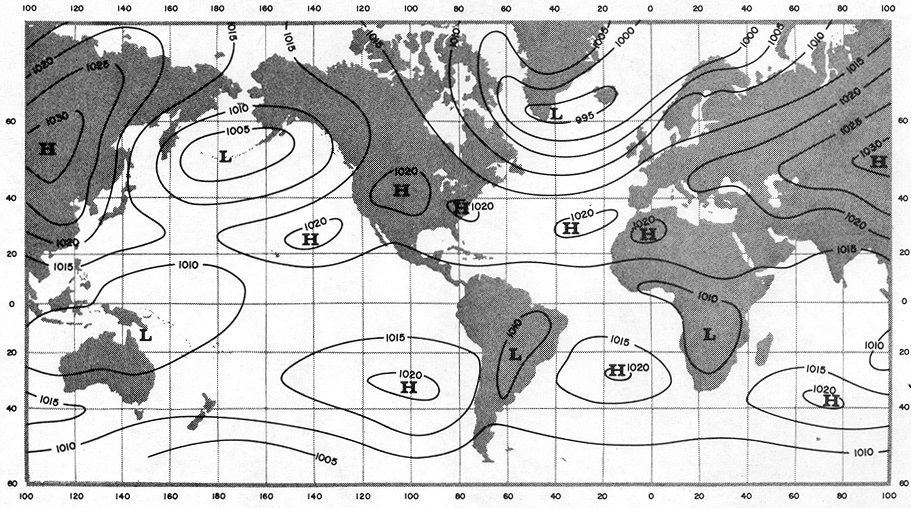
Figure 24. Mean world-wide surface pressure distribution in January. In this season, the pattern in figure 23 is reversed. In the cool Northern Hemisphere, cold continental areas are predominantly areas of high pressure while warm oceans tend to be low pressure areas. In the warm Southern Hemisphere, land ares tend to have low pressure; and oceans, high pressure. The subtropical high pressure belts are evident in both hemispheres. Note that the pressure belts shift southward in January and northward in July with the shift in the zone of maximum heating.
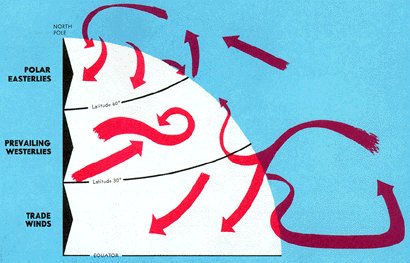
Large masses of cold air break through the northern barrier plunging southward toward the Tropics. Large mid-latitude storms develop between cold outbreaks an carry warm air northward. The result is a mid-latitude band of migratory storms with ever changing weather. Figure 25 is an attempt to standardize this chaotic circulation into an average general circulation.
During summer, warm continents tend to be areas of low pressure and the relatively cool oceans, high pressure. In winter, the reverse is true - high pressure over the cold continents and low pressure over the relatively warm oceans. Figures 23 and 24 show this seasonal pressure reversal. The same pressure variations occur in the warm and cold seasons of the Southern Hemisphere, although the effect is not as pronounced because of the much larger water areas of the Southern Hemisphere. Cold outbreaks are strongest in the cold season and are predominantly from cold continental areas. Summer outbreaks are weaker and more likely to originate from cool water surfaces. Since these outbreaks are masses of cool, dense air, they characteristically are high pressure areas. As the air tries to blow outward from the high pressure, it is deflected to the right by the Coriolis force. Thus, the wind around a high blows clockwise. The high pressure with its associated wind system is an anticyclone. The storms that develop between high pressure systems are characterized by low pressure. As winds try to blow inward toward the center of low pressure, they also are deflected to the right. Thus, the wind around a low is counterclockwise. The low pressure and its wind system is a cyclone. Figure 26 shows winds blowing parallel to isobars (contours on upper level charts). The winds are clockwise around highs and counterclockwise around lows.
These three major wind belts are shown in figure 25. Northeasterly trade winds carry tropical storms from east to west. The prevailing westerlies drive mid-latitude storms generally from west to east. Few major storm systems develop in the comparatively small Arctic region; the chief influence of the polar easterlies is their contribution to the development of mid-latitude storms. Our discussion so far has said nothing about friction. Wind flow patterns aloft follow isobars or contours where friction has little effect. We cannot, however, neglect friction near surface.
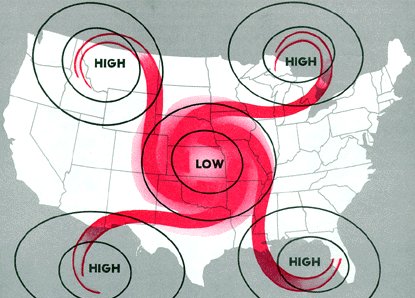
As frictional force slows the windspeed, Coriolis force decreases. However, friction does not affect pressure gradient force. Pressure gradient and Coriolis forces are no longer in balance. The stronger pressure gradient force turns the wind at an angle across the isobars toward lower pressure until the three forces balance as shown in figure 27. Frictional and Coriolis forces combine to just balance pressure gradient force. Figure 28 shows how surface wind spirals outward from high pressure into low pressure crossing isobars at an angle.
Figure 28. Circulation around pressure systems at the surface. Wind spirals outward from high pressure and inward to low pressure, crossing isobars at an angle.
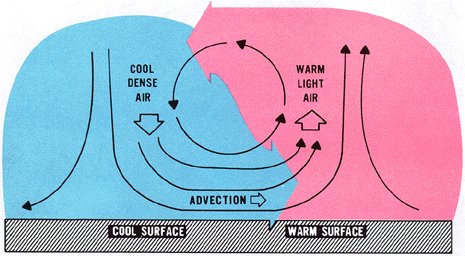
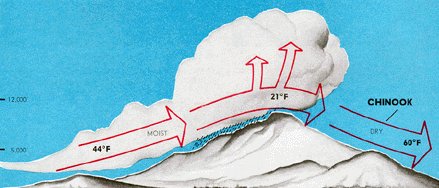
MOUNTAIN AND VALLEY WINDS In the daytime, air next to a mountain slope is heated by contact with the ground as it receives radiation from the sun. This air usually becomes warmer than air at the same altitude but farther from the slope. Colder, denser air in the surroundings settles downward and forces the warmer air near the ground up the mountain slope. This wind is a "valley wind" so called because the air is flowing up out of the valley. At night, the air in contact with the mountain slope is cooled by terrestrial radiation and becomes heavier than the surrounding air. It sinks along the slope, producing the "mountain wind" which flows like water down the mountain slope. Mountain winds are usually stronger than valley winds, especially in winter. The mountain wind often continues down the more gentle slopes of canyons and valleys, and in such cases takes the name "drainage wind." It can become quite strong over some terrain conditions and in extreme cases can become hazardous when flowing through canyon restrictions as discussed in chapter 9. A katabatic wind is any wind blowing down an incline when the incline is influential in causing the wind. Thus, the mountain wind is a katabatic wind. Any katabatic wind originates because, cold, heavy air spills down sloping terrain displacing warmer, less dense air ahead of it. Air is heated and dried as it flows down slope as we will study in later chapters. Sometimes the descending air becomes warmer than the air it replaces. Many katabatic winds recurring in local areas have been given colorful names to highlight their dramatic, local effect. Some of these are the Bora, a cold northerly wind blowing from the Alps to the Mediterranean coast; the Chinook, figure 29, a warm wind down the east slope of the Rocky Mountains often reaching hundreds of miles into the high plains; the Taku, a cold wind in Alaska blowing off the Taku glacier; and the Santa Ana, a warm wind descending from the Sierras into the Santa Ana Valley of California.
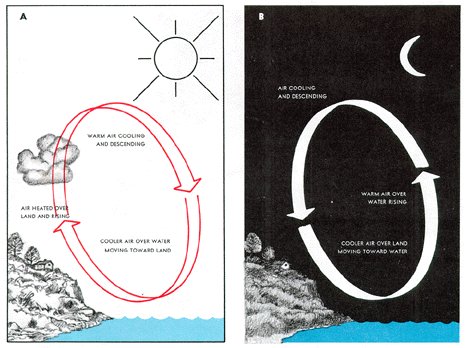
As frequently stated earlier, land surfaces warm and cool more rapidly than do water surfaces; therefore, land is warmer than the sea during the day; winds blows from the cool water to warm land - the "sea breeze" so called because it blows from the sea. At night, the wind reverses, blows from cool land to warmer water, and creates a "land breeze." Figure 30 diagrams land and sea breezes.
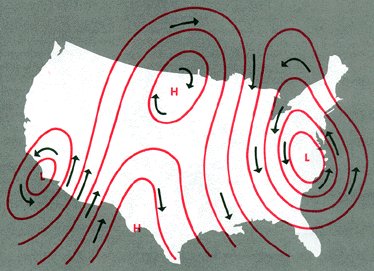
You also can determine wind direction from a weather map. If you face along an isobar or contour with lower pressure on your left, wind will be blowing in the direction you are facing. On a surface map, wind will cross the isobar at an angle toward lower pressure; on an upper air chart, it will be parallel to the contour. Wind blows counterclockwise (Northern Hemisphere) around a low and clockwise around a high. At the surface where winds cross the isobars at an angle, you can see a transport of air from high to low pressure. Although winds are virtually parallel to contours on an upper air chart, there still is a slow transport of air from high to low pressure. At the surface when air converges into a low, it cannot go outward against the pressure gradient, nor can it go downward into the ground; it must go upward.* Therefore, a low or trough is an area of rising air. *You may recall that earlier we said air "piles up" in the vicinity of 30° latitude increasing pressure and forming the subtropical high pressure belt. Why, then, does not air flowing into a low or trough increase pressure and fill the system? Dynamic forces maintain the low or trough; and these forces differ from the forces that maintain the subtropical high. Rising air is conducive to cloudiness and precipitation; thus we have the general association of low pressure - bad weather. Reasons for the inclement weather are developed in later chapters. By similar reasoning, air moving out of a high or ridge depletes the quantity of air. Highs and ridges, therefore, are areas of descending air. Descending air favors dissipation of cloudiness; hence the association, high pressure - good weather. Many times weather is more closely associated with an upper air pattern than with features shown by the surface map. Although features on the two charts are related, they seldom are identical. A weak surface system often loses its identity in the upper air pattern, while another system may be more evident on the upper air chart than on the surface map. Widespread cloudiness and precipitation often develop in advance of an upper trough or low. A line of showers and thunderstorms is not uncommon with a trough aloft even though the surface pressure pattern shows little or no cause for the development. On the other hand, downward motion in a high or ridge places a "cap" on convection, preventing any upward motion. Air may become stagnant in a high, trap moisture and contamination in low levels, and restrict ceiling and visibility. Low stratus, fog, haze, and smoke are not uncommon in high pressure areas. However, a high or ridge aloft with moderate surface winds most often produces good flying weather. Highs and lows tend to lean from the surface into the upper atmosphere. Due to this slope, winds aloft often blow across the associated surface systems. Upper winds tend to steer surface systems in the general direction of the upper wind flow. An intense, cold, low pressure vortex leans less than does a weaker system. The intense low becomes oriented almost vertically and is clearly evident on both surface and upper air charts. Upper winds encircle the surface low and do not blow across it. Thus, the storm moves very slowly and usually causes and extensive and persistent area of clouds, precipitation, strong winds, and generally adverse flying weather. The term cold low sometimes used by the weatherman describes such a system. A contrasting analogy to the cold low is the thermal low. A dry, sunny region becomes quite warm from intense surface heating thus generating a surface low pressure area. The warm air is carried to high levels by convection, but cloudiness is scant because of lack of moisture. Since in warm air, pressure decreases slowly with altitude, the warm surface low is not evident at upper levels. Unlike the cold low, the thermal low is relatively shallow with weak pressure gradients and no well defined cyclonic circulation. It generally supports good flying weather. However, during the heat of the day, one must be alert for high density altitude and convective turbulence. We have cited three exceptions to the low pressure - bad weather, high pressure - good weather rule: (1) cloudiness and precipitation with an upper air trough or low not evident on the surface chart; (2) the contaminated high; and (3) the thermal low. As this book progresses, you can further relate weather systems more specifically to flight operations.
|