|
For Pilots and Flight Operations Personnel
A sailplane must have auxiliary power to become airborne such as a winch, a ground tow, or a tow by a powered aircraft. Once the sailcraft is airborne and the tow cable released, performance of the craft depends on the weather and the skill of the pilot. Forward thrust comes from gliding downward relative to the air the same as thrust is developed in a power-off glide by a conventional aircraft. Therefore, to gain or maintain altitude, the soaring pilot must rely on upward motion of the air. To a sailplane pilot, "lift" means the rate of climb he can achieve in an up current, while "sink" denotes his rate of descent in a downdraft or in neutral air. "Zero sink" means that upward currents are just strong enough to enable him to hold altitude but not to climb. Sailplanes are highly efficient machines; a sink rate of a mere 2 feet per second provides an airspeed of about 40 knots, and a sink rate of 6 feet per second gives an airspeed of about 70 knots. Some two-place training craft have somewhat higher sink rates. In lift, a sailplane pilot usually flies 35 to 40 knots with a sink rate of about 2 feet per second. Therefore, if he is to remain airborne, he must have an upward air current of at least 2 feet per second. There is no point in trying to soar until weather conditions favor vertical speeds greater than the minimum sink rate of the aircraft. These vertical currents develop from several sources, and these sources categorize soaring into five classes: (1) Thermal Soaring, (2) Frontal Soaring, (3) Sea Breeze Soaring, (4) Ridge or Hill Soaring, and (5) Mountain Wave Soaring.
* Peter L. Dixon. SOARING, page 129; 1970; Ballantine Books, New York City. All pilots scan the weather pattern for convective activity. Remember that turbulence is proportional to the speed at which the aircraft penetrates adjacent updrafts and downdrafts. The fast moving powered aircraft experiences "pounding" and tries to avoid convective turbulence. The slower moving soaring pilot enjoys a gradual change from thermals to areas of sink. He chases after local convective cells using the thermals for lift. A soaring aircraft is always sinking relative to the air. To maintain or gain altitude, therefore, the soaring pilot must spend sufficient time in thermals to overcome the normal sink of the aircraft as well as to regain altitude lost in downdrafts. He usually circles at a slow airspeed in a thermal and then darts on a beeline to the next thermal as shown in figure 147.
Since thermals depend on solar heating, thermal soaring is restricted virtually to daylight hours with considerable sunshine. Air tends to become stable at night due to low-level cooling by terrestrial radiation, often resulting in an inversion at or near the surface (see Chapters 3 and 6). Stable air suppresses convection, and thermals do not form until the inversion "burns off" or lifts sufficiently to allow soaring beneath the inversion. The earliest that soaring may begin varies from early forenoon to early afternoon, the time depending on the strength of the inversion and the amount of solar heating. Paramount to a pilot's soaring achievement is his skill in diagnosing and locating thermals. LOCATING THERMALS Since convective thermals develop from uneven heating at the surface, the most likely place for a thermal is above a surface that heats readily. Types of Terrain Surfaces When they sky is cloudless, the soaring pilot must look for those surfaces that heat most rapidly and seek thermals above those areas. Barren sandy or rocky surfaces, plowed fields, stubble fields surrounded by green vegetation, cities, factories, chimneys, etc., are good thermal sources. A pilot learns through experience the most favorable spots in his local area. But terrain features are only part of the story; time of day influences not only when thermals form but also where. Sun Angle Angle of the sun profoundly affects location of thermals over hilly landscapes. During early forenoon, the sun strikes eastern slopes more directly than other slopes; therefore, the most favorable areas for thermals are eastern slopes. The favorable areas move to southern slopes during midday. In the afternoon, they move to western slopes before they begin to weaken as the evening sun sinks toward the western horizon. For example, if a rocky knob protrudes above a grassy plain, the most likely area of thermals is over the eastern slope in the forenoon and the western slope in the afternoon. Once a pilot has sighted a likely surface, he may look for other visual cues. Dust and Smoke Surface winds must converge to feed a rising thermal; so when you sight a likely spot for a thermal, look for dust or smoke movement near the surface. If you can see dust or smoke "streamers" from two or more sources converging on the spot as shown in figure 148(A), you have chosen wisely. If, however, the streamers diverge as shown in figure 148(B), a downdraft most likely hovers over the spot and it's time to move on.
Dust Devils Dust devils occur under sunny skies over sandy or dusty, dry surfaces and are sure signs of strong thermals with lots of lift. To tackle this excellent source of lift, you must use caution. The thermals are strong and turbulent and are surrounded by areas of little lift or possibly of sink. If approaching the dust devil at too low an altitude, an aircraft may sink to an altitude too low for recovery. A recommended procedure is to always approach the whirling vortex at an altitude 500 feet or more above the ground. At this altitude, you have enough airspace for maneuvering in the event you get into a downdraft or turbulence too great for comfort. A dust devil may rotate either clockwise or counterclockwise. Before approaching the dusty column, determine its direction of rotation by observing dust and debris near the surface. Philip Wills* quotes R.H. Swinn, Chief Instructor of the Egyptian Gliding School, on approaching and entering a dust devil: "...at around 500 feet; the pilot turns towards the dust devil and cuts his speed as he approaches it to the minimum consistent with the control of the glider. As he nears the whirling column of sand he makes a circle on the outside of the dust devil against the direction of rotation, care being taken to give it a wider berth on the downwind side. In light of the variometer reading on the initial circle, closer contact is made with the column or a hasty retreat is beat to a safer orbit." * Philip Wills. "On Being a Bird", page 79; 1953; Max Parrish & Co., Ltd. Why should you enter against the direction of rotation? Figure 149 diagrams a horizontal cross section of a clockwise rotating dust devil and ways of entering it. If you enter with the direction of rotation as on the left, the wind speed is added to your airspeed giving you a fast circling speed probably too great to remain in the thermal. Against the rotation as on the right, wind speed is subtracted from airspeed giving you a slow circling speed.
Stay out of the "eye" of the vortex. Centrifugal force in the center throws air outward, greatly reducing pressure within the hollow center. The rarified air in the center provides very little lift, and the wall of the hollow center is very turbulent. Further quoting Mr. Swinn,* "A too tight turn on the downwind side put a part of my inside wing into the vortex; the shock threw me into the straps and the wing bent in an alarming manner. This central area of greatly reduced pressure is something to be experienced to be believed. Closely following on this was the shock of hitting the area of greatest uplift just outside the central core. The net result was that the machine was thrown completely out of the column." * Ibid., page 80. Mr. Wills' book discusses at length the splendors and perils of dust devil flying by an experienced soaring pilot. It is recommended reading for a greater insight into this special aspect of soaring. If you are 500 feet or more above the ground but having trouble finding lift, the dust devil is well worth a try. If the thermal is sufficiently broad to permit circling within it, you have it made. The dust column may be quite narrow, but this fact does not necessarily mean the thermal is narrow; the thermal may extend beyond the outer limits of visible dust. The way to find out is to try it. Approach the dusty column against the direction of rotation at minimum airspeed. Enter the column near the outer edge of the dust and stay away from the hollow vortex core. Remain alert; you are circling little more than a wing span away from violent turbulence. Birds and Sailplanes Soaring birds have an uncanny ability to locate thermals. When birds remain airborne without flapping their wings, they are riding a thermal. A climbing sailplane also shows the pilot's skill in locating thermals. When fishermen are scattered along a river bank or lake shore, the best place to cast your line is near the fisherman who is catching fish. So it is with soaring. Slip in below the successfully soaring aircraft and catch the thermal he is riding or cut in among or below soaring birds. Wind causes a thermal to lean with altitude. When seeking the thermal supporting soaring birds or aircraft, you must make allowance for the wind. The thermal at lower levels usually is upwind from your high level visual cue. A thermal may not be continuous from the surface upward to the soaring birds or sailplane; rather it may be in segments or bubbles. If you are unsuccessful in finding the thermal where you expect it, seek elsewhere. Cumulus clouds When convective clouds develop, thermal soaring usually is at its best and the problem of locating thermals is greatly simplified. In chapter 6 we learned that upward moving air expands and cools as it rises. If the air is moist enough, expansional cooling lowers temperature to the dew point; a convective, or cumulus, cloud forms atop the thermal. Cumulus clouds are positive signs of thermals, but thermals grow and die. A cloud grows with a rising thermal; but when the thermals dies, the cloud slowly evaporates. Because the cloud dissipates after the thermal ceases, the pilot who can spot the difference between a growing and dying cumulus has enhanced his soaring skill. The warmest and most rapidly rising air is in the center of the thermal. Therefore, the cloud base will be highest in the center giving a concave shape to the cloud base as shown in the left and center of figure 150. When the thermal ceases, the base assumes a convex shape as shown on the right. Another cue to look for is the outline of the cloud sides and top. Outline of the growing cumulus is firm and sharp. The dying cumulus has fragmentary sides and lacks the definite outline. These outlines are diagrammed also in figure 150. Figure 151 is a photograph of a dying cumulus.
Figure 151. Photograph of a dying cumulus. Note the indistinct edges and cloud fragments. The base appears to be convex. One would expect little or no lift beneath this cloud. In contrast, note the top of the cumulus in the lower left corner. Edges are more defined, and a thermal is more likely under this cloud.
As a cumulus cloud grows, it may shade the surface that generated it. The surface cools, temporarily arresting the thermal. As the cloud dissipates or drifts away with the wind, the surface again warms and regenerates the thermal. This intermittent heating is one way in which thermals occur as segments or bubbles. Cloud cover sometimes increases as surface heating increases until much of the sky is covered. Again, surface heating is cut off causing the thermals to weaken or cease entirely. The cloudiness may then decrease. If it is not too late in the day, thermals will regenerate. In the interim period of extensive cloud cover, you may have no choice but to land and wait for the clouds to move on or decrease in coverage. The clouds may build upward to a high level inversion and spread out at the base of the inversion to cover much of the sky. Solar heating is cut off and thermals weaken or die. This type of cloudiness can be persistent, often remaining until near sunset, and can halt thermal soaring until another day. Although abundant convective cloud cover reduces thermal activity, we cannot quote a definite amount that renders thermals too weak for soaring. About 5/10 cover seems to be a good average approximation. Restriction of thermals by cumulus cloudiness first becomes noticeable at low levels. A sailplane may be unable to climb more than a few hundred feet at a low altitude while pilots at higher levels are maintaining height in or just beneath 6/10 to 8/10 convective cloud cover. Towering Cumulus and Cumulonimbus When air is highly unstable, the cumulus cloud can grow into a more ambitious towering cumulus or cumulonimbus. These clouds are a different breed. The energy released by copious condensation can increase buoyancy until the thermals become violent (see chapters 6, 7, and 11). Towering cumulus can produce showers. The cumulonimbus is the thunderstorm cloud producing heavy rain, hail, and icing. Well developed towering cumulus and cumulonimbus are for the experienced pilot only . Some pilots find strong lift in or near convective precipitation, but they avoid hail which can seriously batter the aircraft and ultimately deplete the wallet. Violent thermals just beneath and within these highly developed clouds often are so strong that they will continue to carry a sailplane upward even with nose down and airspeed at the redline. The unwary pilot may find himself sucked into the cloud. The soaring pilot who inadvertently entered a thunderstorm and returned to tell about it never hankers for a repeat performance. Middle and High Cloudiness Dense, broken or overcast middle and high cloudiness shade the surface cutting off surface heating and convective thermals. On a generally warm bright day but with thin or patchy middle or high cloudiness, cumulus may develop, but the thermals are few and weak. The high level cloudiness may drift by in patches. Thermals may surge and wane as the cloudiness decreases and increases. Never anticipate optimum thermal soaring when plagued by these mid- and high-level clouds. Altocumulus castellanus clouds, middle-level convective clouds shown in figure 152, develop in updrafts at and just below the cloud levels. They do not extend upward from the surface. If a sailplane can reach levels near the cloud bases, the updrafts with altocumulus castellanus can be used in the same fashion as thermals formed by surface convection. The problem is reaching the convective level.
Wet ground favors thermals less than dry ground since wet ground heats more slowly (see Chapter 2, "Heat and Temperature"). Some flat areas with wet soil such as swamps and tidewater areas have reputations for being poor thermal soaring areas. Convective clouds may be abundant but thermals generally are weak. Showery precipitation from scattered cumulus or cumulonimbus is a sure sign of unstable air favorable for thermals. But when showers have soaked the ground in localized areas, downdrafts are almost certain over these wet surfaces. Avoid shower soaked areas when looking for lift. So much for locating thermals. A pilot can also enhance his soaring skill by knowing what goes on within a thermal. THERMAL STRUCTURE Thermals are as varied as trees in a forest. No two are exactly alike. When surface heating is intense and continuous, a thermal, once begun, continues for a prolonged period in a steady column as in figure 153. Sometimes called the "chimney thermal," this type seems from experience to be most prevalent. In the chimney thermal, lift is available at any altitude below a climbing sailplane or soaring birds.
When heating is slow or intermittent, a "bubble" may be pinched off and forced upward; after an interval ranging from a few minutes to an hour or more, another bubble forms and rises as in Figure 154. As explained earlier, intermittent shading by cumulus clouds forming atop a thermal is one reason for the bubble thermal. A sailplane or birds may be climbing in a bubble, but an aircraft attempting to enter the thermal at a lower altitude may find no lift.
Thermals develop with a calm condition or with light, variable wind. However, it seems, that a surface wind of 5 to 10 knots favors more organized thermals. A surface wind in excess of 10 knots usually means stronger winds aloft resulting in vertical wind shear. This shear causes thermals to lean noticeably. When seeking a thermal under a climbing sailplane and you know or suspect that thermals are leaning in shear, look for lift upwind from the higher aircraft as shown in figure 156.
No critical surface wind speed can tell us when to expect such a shear. However, shearing action often is visible in cumulus clouds. A cloud sometimes leans but shows a continuous chimney. At other times, the clouds are completely severed into segments by the shear as in figure 157. Remember, however, that this shearing action is at cloud level; thermals below the clouds may be well organized.
Thermal Streets Not infrequently, thermals become organized into "thermal streets." Generally, these streets are parallel to the wind; but on occasion they have been observed at right angles to the wind. They form when wind direction changes little throughout the convective layer and the layer is capped by very stable air. The formation of a broad system of evenly spaced streets is enhanced when wind speed reaches a maximum within the convective layer; that is, wind increases with height from the surface upward to a maximum and then decreases with height to the top of the convective layer. Figure 158 diagrams conditions favorable for thermal streeting. Thermal streeting may occur either in clear air or with convective clouds.
Since thermals are a product of instability, height of thermals depends on the depth of the unstable layer, and their strength depends on the degree of instability. If the idea of instability is not clear to you, now is the time to review chapter 6. Most likely you will be soaring from an airport with considerable soaring activity - possibly the home base of a soaring club - and you are interested in a soaring forecast. Your airport may have an established source of a daily soaring weather forecast from the National Weather Service. If conditions are at all favorable for soaring, you will be specifically interested in the earliest time soaring can begin, how high the thermals will be, strength of the thermals, cloud amounts - both convective and higher cloudiness - visibility at the surface and at soaring altitudes, probability of showers, and winds both at the surface and aloft. The forecast may include such items as the thermal index (TI), the maximum temperature forecast, and the depth of the convective layer. Many of these parameters the forecaster determines from upper air soundings plotted on a pseudo-adiabatic chart. If you become familiar with this chart, you can better grasp the meanings of some of these forecast parameters; and you may try a little forecasting on your own. The pseudo-adiabatic chart is used to graphically compute adiabatic changes in vertically moving air and to determine stability. It has five sets of lines shown in figure 160. These are: 1. Pressure in millibars (horizontal lines), * Ratio of water vapor to dry air. The chart also has an altitude scale in thousands of feet along the right margin and a Fahrenheit temperature scale across the bottom.
Examples shown here deal with dry thermals; and since the red lines in figure 160 concern moist adiabatic changes, they are omitted from the examples. If you care to delve deeper into use of the chart, you will find moist adiabatic processes even more intriguing than dry processes. An upper air observation, or sounding, is plotted on the pseudo-adiabatic chart as shown by the heavy, solid black line in figure 161. This plotting is the vertical temperature profile at the time the radiosonde observation was taken. It is the actual or existing lapse rate (see chapter 6). Blue lines are added to the illustration showing appropriate altitudes to aid you in interpreting the chart.
We know that for air to be unstable, the existing lapse rate must be equal to or greater than the dry adiabatic rate of cooling. In other words, in figure 161, the solid black line representing the plotted existing lapse rate would slope parallel to or slope more than the dry adiabats. Obviously it does not. Therefore, at the time the sounding was taken, the air was stable; there was no convective or unstable layer, and thermals were nonexistent. Thermal soaring was impossible. Now assume that the sounding was made about the time of sunrise. Surface temperature was 59° F (15° C). As temperature rises near the surface during the day, air in the lower levels is warmed and forced upward, cooling at the dry adiabatic rate. Convection begins in the lowest levels. By the time the surface temperature reaches 80° F (about 27° C), convection lifts the air to the level at which it cools adiabatically to the temperature of the surrounding air at 5,000 feet. The existing lapse rate now becomes dry adiabatic from the surface to 5,000 feet and follows the dashed line from the surface to that level. Surface elevation is 2,000 feet ASL; so the convective layer is now 3,000 feet deep. Thermals exist to 3,000 feet above the surface, and low-level soaring is now possible. Above 5,000 feet the lapse rate still is essentially unchanged from the initial lapse rate. Maximum Height of Thermals Let's further assume that maximum temperature forecast for the day is 90° F (about 30° C). Plot 90° F at the surface elevation and draw a line (the dashed black line) parallel to the dry adiabats to the level at which it intersects the early morning sounding. This level is 13,000 feet ASL. The convective layer at time of maximum heating would be 11,000 feet deep and soaring should be possible to 13,000 feet ASL. The existing lapse rate in the heat of the day would follow the dashed line from the surface to 13,000 feet; above 13,000 the lapse rate would remain essentially unchanged. Remember that we are talking about dry thermals. If convective clouds form below the indicated maximum thermal height, they will greatly distort the picture. However, if cumulus clouds do develop, thermals below the cloud base should be strengthened. If more higher clouds develop than were forecast, they will curtail surface heating, and most likely the maximum temperature will be cooler than forecast. Thermals will be weaker and will not reach as high an altitude. Thermal Index (TI) Since thermals depend on sinking cold air forcing warm air upward, strength of thermals depends on the temperature difference between the sinking air and the rising air - the greater the temperature difference the stronger the thermals. To arrive at an approximation of this difference, the forecaster computes a thermal index (TI). A thermal index may be computed for any level; but ordinarily, indices are computed for the 850- and 700-millibar levels, or about 5,000 and 10,000 feet respectively. These levels are selected because they are in the altitude domain of routine soaring and because temperature data are routinely available for these two levels. Three temperature values are needed - the observed 850-millibar and 700-millibar temperatures and the forecast maximum temperature. Let's assume a sounding as in figure 162 with an 850-millibar temperature of 15° C, a 700-millibar temperature of 10° C, and forecast maximum of 86° F (30° C). Plot the three temperatures using care to place the maximum temperature plot at field elevation (2,000 feet in figure 162). Now draw a line (the black dashed line) through the maximum temperature parallel to the dry adiabats. Note that the dashed line intersects the 850-millibar level at 20° C and 700-millibar level at 4° C. Algebraically subtract these temperatures from actual sounding temperatures at corresponding levels. Note the difference is -5° C at 850-millibars (15 - 20 = -5) and +6 at 700-millibars (10 - 4 = +6). These values are the TIs at the two levels.
Figure 163 is another example showing an early morning sounding with a 3,000-foot surface temperature of 10° C (50° F), an 850-millibar temperature of 15° C, a 700-millibar temperature of 3° C, and a forecast maximum of 86° F (30° C). What are the TIs at 850 and 700 millibars? Would you expect thermals to 850 millibars? Would they be moderate, strong, or weak? How about at 700 millibars? What is the maximum altitude you would expect thermals to reach? Answers: 850-millibar TI, -8; 700-millibar TI, -5; thermals would reach both levels, strong at 850, moderate at 700; maximum altitude of thermals, about 16,000 feet ASL.
Do It Yourself The first step in determining height and strength of thermals is to obtain a local sounding. How do you get a local sounding? Send your tow aircraft aloft about sunrise and simply read outside air temperatures from the aircraft thermometer and altitudes from the altimeter. Read temperatures at 500 foot intervals for about the first 2,000 feet and at 1,000 foot intervals at higher altitudes. The information may be radioed back to the ground, or may be recorded in flight and analyzed after landing. When using the latter method, read temperatures on both ascent and descent and average the temperatures at each level. This type of sounding is an airplane observation or APOB. Plot the sounding on the pseudo-adiabatic chart using the altitude scale rather than the pressure scale. Next we need a forecast maximum temperature. Perhaps you can pick up this forecast temperature from the local forecast. If not, you can use your best judgment comparing today's weather with yesterday's. Following is an APOB as taken by the tow aircraft from an airport elevation of 1,000 feet ASL:
Plot the APOB on the pseudo-adiabatic chart using the average temperatures from the last column. Figure 164 shows the plotted APOB.
Although these procedures are primarily for dry thermals, they work reasonably well for thermals below the bases of convective clouds. Convective Cloud Bases Soaring experience suggests a shallow, stable layer immediately below the general level of convective cloud bases through which it is difficult to soar. This layer is 200 to 600 feet thick and is known as the sub-cloud layer. The layer appears to act as a filter allowing only the strongest thermals to penetrate it and form convective clouds. Strongest thermals are beneath developing cumulus clouds. Thermals intensify within a convective cloud; but evaporation cools the outer edges of the cloud causing a downdraft immediately surrounding it. Add to this the fact that downdrafts predominate between cumulus clouds, and you can see the slim chance of finding lift between clouds above the level of the cloud base. In general, thermal soaring during convective cloud activity is practical only at levels below the cloud base. In chapter 6, we learned to estimate height in thousands of feet of a convective cloud base by dividing the surface temperature-dew point spread by 4. If the rising column were self-contained - that is, if no air were drawn into the sides of the thermal - the method would give a fairly accurate height of the base. However, this is not the case. Air is entrained or drawn into the sides of the thermal; and this entrained air lowers the water vapor content of the thermal allowing it to reach a somewhat higher level before condensation occurs. Bases of the clouds are generally 10 to 15 percent higher than the computed height. Entrainment is a sticky problem; observers and forecasters can only estimate its effect. Until a positive technique is developed, heights of cumulus bases will tend to be reported and forecast too low. Currently, in the eastern United States, cumulus bases are seldom reported above 6,000 feet when the base may actually be 7,000 or 8,000 feet. In the western part of the country, cumulus bases have been observed by aircraft at 12,000 to 14,000 feet above the ground but seldom are reported above 10,000 feet CROSS-COUNTRY THERMAL SOARING A pilot can soar cross-country using either isolated thermals or thermal streets. When using isolated thermals, he gains altitude circling in thermals and then proceeds toward the next thermal in the general direction of his cross-country. Under a thermal street, he may be able to proceed with little if any circling if his chosen course parallels the thermal streets. It goes without saying that he can obtain the greatest distance by flying in the direction of the wind. In the central and eastern United States, the most favorable weather for cross-country soaring occurs behind a cold front. Lindsay* has found that about 82 percent of thermal cross-countrys in these areas were made after a cold front had passed and ahead of the following high pressure center. Four factors contribute to making this pattern ideal. (1) The cold polar air is usually dry, and thermals can build to relatively high altitudes. (2) The polar air is colder than the ground; and thus, the warm ground aids solar radiation in heating the air. Thermals begin earlier in the morning and last later in the evening. On occasions, soarable lift has been found at night. (3) Quite often, colder air at high altitudes moves over the cold, low level outbreak intensifying the instability and strengthening the thermals. (4) The wind profile frequently favors thermal streeting - a real boon to speed and distance. * Charles V. Lindsay. "Types of Weather Favoring Cross-Country Soaring." Soaring , December 1964, pp. 6-9. The same four factors may occur with cold frontal passages over mountainous regions in the western United States. However, rugged mountains break up the circulation; and homogeneous conditions extend over smaller areas than over the eastern parts of the country. The western mountain regions and particularly the desert southwest have one decided advantage. Air is predominantly dry with more abundant daytime thermal activity favoring cross-country soaring although it may be for shorter distances. Among the world's most favorable tracks for long distance soaring is a high plains corridor along the east slope of the Rocky Mountains stretching from southwest Texas to Canada.** Many cross-country records have been set in this corridor, Southwest Texas is the chosen site for many national and international soaring meets. Terrain in the corridor is relatively flat and high with few trees; terrain surface ranges from barren to short grass. These surface features favor strong thermal activity. Prevailing wind is southerly and moderately strong giving an added boost to northbound cross-countrys. ** For an in-depth discussion of this area, see "Thermal Soaring - Southwest Style," by David H Owens, Soaring , May 1966, pp. 10-12.
A front can on occasion provide excellent lift for a short period. You may on a cross-country be riding wave or ridge lift and need to move over a flat area to take advantage of thermals. A front may offer lift during your transition. Fronts often are marked by a change in cloud type or amount. However, the very presence of clouds may deter you from the front. Spotting a dry front is difficult. Knowing that a front is in the vicinity and studying your aircraft reaction can tell you when you are in the frontal lift. Staying in the lift is another problem. Observing ground indicators of surface wind helps. An approaching front may enhance thermal or hill soaring. An approaching front or a frontal passage most likely will disrupt a sea breeze or mountain wave. Post frontal thermals in cold air were discussed earlier.
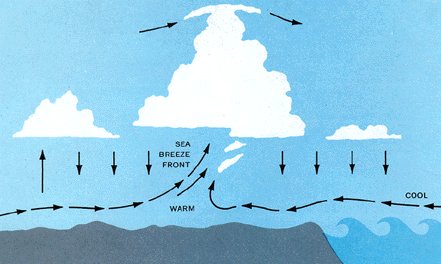
SEA BREEZE FRONT Sometimes the wedge of cool air is called a sea breeze front. If sufficient moisture is present, a line of cumuliform clouds just inland may mark the front. Whether marked by clouds or not, the upward moving air at the sea breeze front occasionally is strong enough to support soaring flight. Within the sea breeze, i.e., between the sea breeze front and the ocean, the air is usually stable, and normally, no lift may be expected at lower levels. However, once airborne, pilots occasionally have found lift at higher levels in the return flow aloft. A visual indication of this lift is cumulus extending seaward from the sea breeze front. The properties of a sea breeze front and the extent of its penetration inland depend on factors such as the difference in land and sea water temperatures, general wind flow, moisture, and terrain. Land vs. Sea Water Temperature A large difference in land and sea water temperature intensifies the convective cell generating a sea breeze. Where coastal waters are quite cool, such as along the California coast, and land temperatures warm rapidly in the daytime, the sea breeze becomes pronounced, penetrating perhaps 50 to 75 miles inland at times. Copious sunshine and cool sea waters favor a well developed sea breeze front. Strength and Direction of General Wind The sea breeze is a local effect. Strong pressure gradients with a well developed pressure system can overpower the sea breeze effect. Winds will follow the direction and speed dictated by the strong pressure gradient. Therefore, a sea breeze front is most likely when pressure gradient is weak and wind is light. When convection is very deep, the frontal effect of a sea breeze may sometimes trigger cumulonimbus clouds provided the lifted air over land contains sufficient moisture. More often, the cumulus are of limited vertical extent. Over vegetation where air is usually moist, sea breeze cumulus are the rule. Over arid regions, little or no cumulus development may be anticipated with a sea breeze front. Terrain Irregular or rough terrain in a coastal area may amplify the sea breeze front and cause convergence lines of sea breezes originating from different areas. Southern California and parts of the Hawaiian Islands are favorable for sea breeze soaring because orographic lift is added to the frontal convection. Sea breezes occasionally may extend to the leeward sides of hills and mountains unless the ranges are high and long without abrupt breaks. In either case, the sea breeze front converges on the windward slopes, and upslope winds augment the convection. Where terrain is fairly flat, sea breezes may penetrate inland for surprising distances but with weaker lift along the sea breeze front. In the Tropics, sea breezes sometimes penetrate as much as 150 miles inland, while an average of closer to 50 miles inland is more usual in middle latitudes. Sea breezes reaching speeds of 15 to 25 knots are not uncommon. VISUAL CLUES When a sea breeze front develops, visual observations may provide clues to the extent of lift that you may anticipate, viz: 1. Expect little or no lift on the seaward side of the front when the sea air is markedly void of convective clouds or when the sea breeze spreads low stratus inland. However, some lift may be present along the leading edge of the sea breeze or just ahead of it. LOCAL SEA BREEZE EXPLORATIONS Unfortunately, a sea breeze front is not always easy to find, and it is likely that many an opportunity for sea breeze soaring goes unnoticed. As yet, little experience has been accrued in locating a belt of sea breeze lift without visual clues such as clouds, haze, or converging smoke or dust plumes. As the sport of soaring grows, so will the knowledge of sea breeze soaring expand and the peculiarities of more local areas come to light. In the United States, the area where the most experience probably has been gained is over the southern California high desert where the sea breeze moves eastward over the Los Angeles Coastal Plain into the Mojave Desert. Los Angeles "Smoke Front" The sea breeze front moving from the Los Angeles coastal plain into the Mojave Desert has been dubbed the "Smoke Front." It has intense thermal activity and offers excellent lift along the leading edge of the front. Associated with the sea breeze that moves inland over the Los Angeles coastal plain are two important zones of convergence, shown in figure 166. Sea breezes of different origin meet in the convergence zones producing vertical currents capable of supporting sailplanes. One convergence line is the "San Fernando Convergence Zone," a larger scale zone is in the Elsinore area, also shown in figure 166. This convergence zone apparently generates strong vertical currents since soaring pilots fly back and forth across the valley along the line separating smoky air to the north from relatively clear air to the south. Altitudes reached depend upon the stability, but usually fall within the 6,000 feet to 12,000 feet ASL range for the usual dry thermal type lift. Seaward, little or no lift is experienced in the sea breeze air marked by poor visibility.
Figure 167 shows converging air between sea breezes flowing inland from opposite coasts of the Cape Cod Peninsula. Later in the development of the converging sea breezes, the onset of convection is indicated by cumulus over the peninsula. Sailplane pilots flying over this area as well as over Long Island, New York, have found good lift in the convergence lines caused by sea breezes blowing inland from both coasts of the narrow land strips.
Sea breeze fronts have been observed along the shore lines of the Great Lakes. Weather satellites have also photographed this sea breeze effect on the western shore of Lake Michigan. It is quite likely that conditions favorable for soaring occur at times.
To create lift over hills or ridges, wind direction should be within about 30 to 40° normal to the ridge line. A sustained speed of 15 knots or more usually generates enough lift to support a sailplane. Height of the lift usually is two or three times the height of the rise from the valley floor to the ridge crest. Strong winds tend to increase turbulence and low level eddies without an appreciable increase in the height of the lift. STABILITY Stability affects the continuity and extent of lift over hills or ridges. Stable air allows relatively streamlined upslope flow. A pilot experiences little or no turbulence in the steady, uniform area of best lift shown in figure 168. Since stable air tends to return to its original level, air spilling over the crest and downslope is churned into a snarl of leeside eddies, also shown in figure 168. Thus, stable air favors smooth lift but troublesome leeside low altitude turbulence. When the airstream is moist and unstable, upslope lift may release the instability generating strong convective currents and cumulus clouds over windward slopes and hill crests. The initially laminar flow is broken up into convective cells. While the updrafts produce good lift, strong downdrafts may compromise low altitude flight over rough terrain. As with thermals, the lift will be transitory rather than smooth and uniform. STEEPNESS OF SLOPE Very gentle slopes provide little or no lift. Most favorable for soaring is a smooth, moderate slope. An ideal slope is about 1 to 4 which with an upslope wind of 15 knots creates lift of about 6 feet per second. With the same slope, a high performance sailcraft with a sinking speed of 2 feet per second presumably could remain airborne with only a 5 knot wind! Very steep escarpments or rugged slopes induce turbulent eddies. Strong winds extend these eddies to a considerable height usually disrupting any potential lift. The turbulent eddies also enhance the possibility of a low altitude upset. CONTINUITY OF RIDGES Ridges extending for several miles without abrupt breaks tend to provide uniform lift throughout their length. In contrast, a single peak diverts wind flow around the peak as well as over it and thus is less favorable for soaring. Figure 169 shows wind flow around an isolated peak.
The soaring pilot, always alert, must remain especially so in seeking or riding hill lift. You may be able to spot indicators of good lift. Other clues may mark areas to avoid. When air is unstable, do not venture too near the slope. You can identify unstable air either by the updrafts and downdrafts in dry thermals or by cumulus building over hills or ridges. Approaching at too low an altitude may suddenly put you in a downdraft, forcing an inadvertent landing. When winds are strong, surface friction may create low level eddies even over relatively smooth slopes. Also, friction may drastically reduce the effective wind speed near the surface. When climbing at low altitude toward a slope under these conditions, be prepared to turn quickly toward the valley in event you lose lift. Renew your attempt to climb farther from the hill. If winds are weak, you may find lift only very near the sloping surface. Then you must "hug" the slope to find needed lift. However, avoid this procedure if there are indications of up and down drafts. In general, for any given slope, keep your distance from the slope proportional to wind speed. Leeward of hills and ridges is an area where wind is blocked by the obstruction. Among soaring circles this area is called the "wind shadow." In the wind shadow, downdrafts predominate as shown in figure 168. If you stray into the wind shadow at an altitude near or below the altitude of the ridge crest, you may be embarrassed by an unscheduled and possibly rough landing. Try to stay within the area of best lift shown in figure 168.
When strong winds blow across a mountain range, large "standing" waves occur downwind from the mountains and upward to the tropopause. The waves may develop singly; but more often, they occur as a series of waves downstream from the mountains. While the waves remain about stationary, strong winds are blowing through them. You may compare a mountain wave to a series of waves formed downstream from a submerged rocky ridge in a fast flowing creek or river. Air dips sharply immediately to the lee of a ridge, then rises and falls in a wave motion downstream. A strong mountain wave requires: 1. Marked stability in the airstream disturbed by the mountains. Rapidly building cumulus over the mountains visually marks the air unstable; convection, evidenced by the cumulus, tends to deter wave formation. 2. Wind speed at the level of the summit should exceed a minimum which varies from 15 to 25 knots depending on the height of the range. Upper winds should increase or at least remain constant with height up to the tropopause. 3. Wind direction should be within 30° normal to the range. Lift diminishes as winds more nearly parallel the range. Wave length is the horizontal distance between crests of successive waves and is usually between 2 and 25 miles. In general, wave length is controlled by wind component perpendicular to the ridge and by stability of the upstream flow. Wave length is directly proportional to wind speed and inversely proportional to stability. Figure 172 illustrates wave length and also amplitude.
VISUAL INDICATORS If the air has sufficient moisture, lenticular (lens shaped) clouds mark wave crests. Cooling of air ascending toward the wave crest saturates the air forming clouds. Warming of air descending beyond the wave crest evaporates the cloud. Thus, by continuous condensation windward of the wave crest and evaporation leeward, the cloud appears stationary although wind may be blowing through the wave at 50 knots or more. Lenticular clouds in successive bands downstream from the mountain mark a series of wave crests. Spacing of lenticulars marks the wave length. Clearly identifiable lenticulars also suggest larger wave amplitude than clouds which barely exhibit lenticular form. These cloud types along with stratiform clouds on the windward slopes and along the mountain crest indicate the stability favorable to mountain wave soaring. Thunderstorms or rapidly building cumulus over mountains mark the air unstable. As they reach maturity, the thunderstorms often drift downwind across leeward valleys and plains. Strong convective currents in the unstable air deter wave formation. If you sight numerous instability clouds, wait until another day for mountain wave soaring. SOARING TURBULENCE A mountain wave, in a manner similar to that in a thermal, means turbulence to powered aircraft, but to a slowly moving sailcraft, it produces lift and sink above the level of the mountain crest. But as air spills over the crest like a waterfall, it causes strong downdrafts. The violent overturning forms a series of "rotors" in the wind shadow of the mountain which are hazardous even to a sailplane (see chapter 9, figs. 81 through 84). Clouds resembling long bands of stratocumulus sometimes mark the area of overturning air. These "rotor clouds" appear to remain stationary, parallel the range, and stand a few miles leeward of the mountains. Turbulence is most frequent and most severe in the standing rotors just beneath the wave crests at or below mountain top levels. This rotor turbulence is especially violent in waves generated by large mountains such as the Rockies. Rotor turbulence with lesser mountains is much less severe but is always present to some extent. The turbulence is greatest in well developed waves. Mountain waves occur most frequently along the central and northern Rockies and the northern Appalachians. Occasionally, waves form to the lee of mountains in Arkansas, Oklahoma, and southwestern Texas. Weather satellites have observed waves extending great distances downwind from the Rocky Mountains; one series extended for nearly 700 miles. The more usual distance is 150 to 300 miles. While Appalachian waves are not as strong as those over the Rockies, they occur frequently; and satellites have observed them at an average of 115 miles downwind. Wave length of these waves averages about 10 nautical miles. RIDING THE WAVES You often can detect a wave by the uncanny smoothness of your climb. On first locating a wave, turn into the wind and attempt to climb directly over the spot where you first detected lift provided you can remain at an altitude above the level of the mountain crest. The lee side turbulent area is for the experienced pilot only. After cautiously climbing well up into the wave, attempt to determine dimensions of the zone of lift. If the wave is over rugged terrain, it may be impossible and unnecessary to determine the wave length. Lift over such terrain is likely to be in patchy bands. Over more even terrain, the wave length may be easy to determine and use in planning the next stage of flight. Wave clouds are a visual clue in your search for lift. The wave-like shape of lenticulars is usually more obvious from above than from below. Lift should prevail from the crest of the lenticulars upwind about one-third the wave length. When your course takes you across the waves, climb on the windward side of the wave and fly as quickly as possible to the windward side of the next wave. Wave lift of 300 to 1,200 feet per minute is not uncommon. Soaring pilots have encountered vertical currents exceeding 3,000 feet per minute, the strongest ever reported being 8,000 feet per minute
We sincerely hope that this chapter has given you insight into the minute variations in weather that profoundly affect a soaring aircraft. When you have remained airborne for hours without power, you have met a unique challenge and experienced a singular thrill of flying.
|